
Gustavo de Castro
Data Analyst | Business Analyst
About Me
Hi 👋, I'm Gustavo de Castro but you can call me 'Gus' 😉🎯I'm a Data Analyst with strong international experience in data analysis, visualization, and digital performance tracking. Skilled in tools like Power BI, SQL, Python, Looker Studio, and Google Analytics, I specialize in transforming complex data into actionable business insights.
Skills

Excel | GA4 | Tableau | Power BI | SQL | Python
Data Analyst - 5+ years
Data Visualisation - 4+ years
SQL - 3+ years
GA4 - 2+ years
Python- 1+ years
Featured Projects
POWER BI
TICKET SUPPORT DASHBOARD
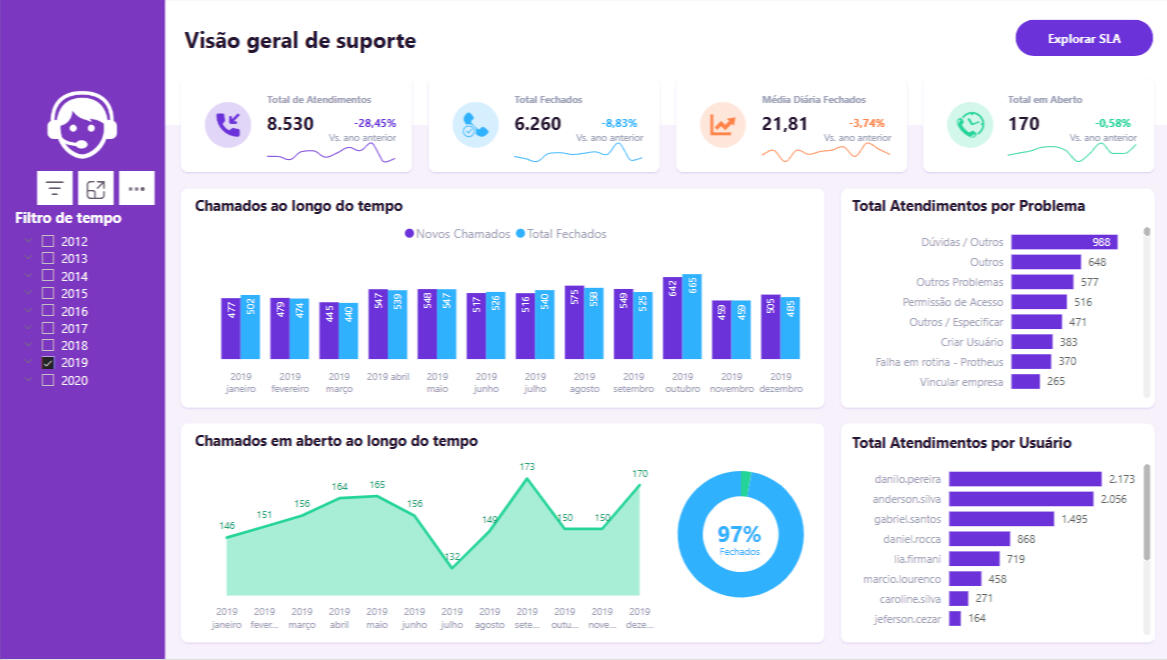
The Ticket Support Dashboard offers an overview of the ticketing process, tracking ticket lifecycle, SLA compliance, user activity, and operational efficiency.


POWER BI
Logistic DASHBOARD
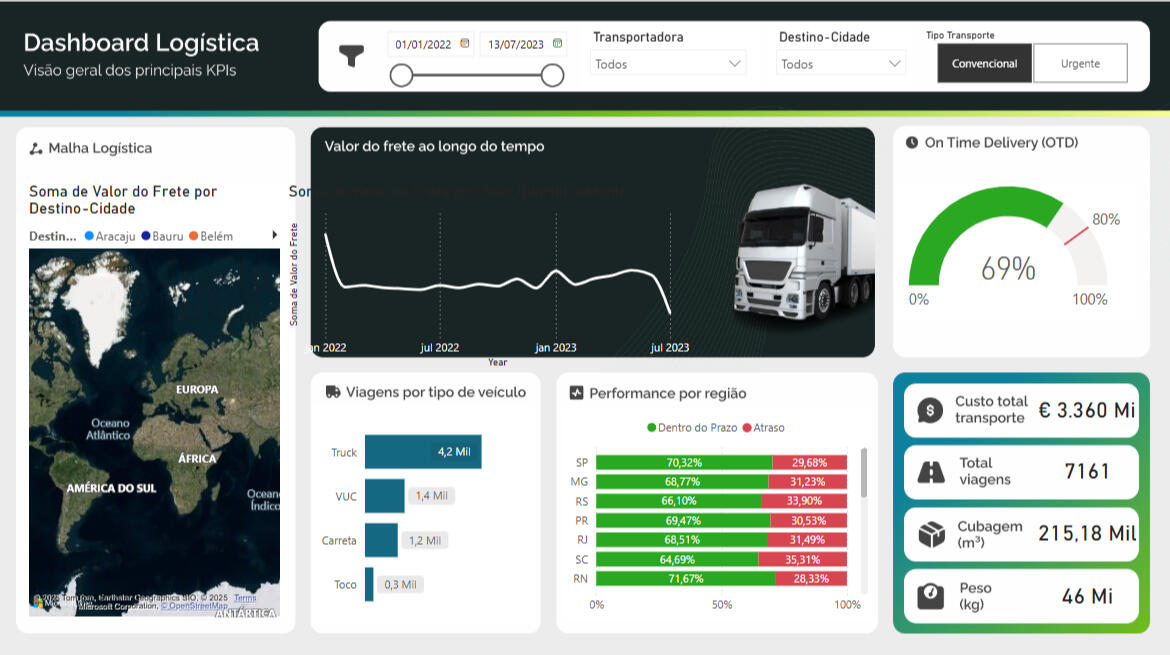
The Logistics Dashboard helps improve efficiency and customer satisfaction by providing monthly insights into transport operations, route analysis, carrier performance, and resource use.
POWER BI
FINANCIAL DASHBOARD
The Financial Dashboard, built in Power BI, supports cash flow management with detailed insights into revenues, expenses, and strategic resource planning.

POWER BI
TICKET SUPPORT DASHBOARD
Ticket Support Dashboard
Summary
The Ticket Support Dashboard provides a comprehensive overview of the ticketing process within the organization, enabling monitoring, analysis, and optimization of support performance. It integrates key data points related to ticket lifecycle, SLA compliance, user activity, and operational efficiency.Core Metrics and Dimensions Included
· Ticket Information
· Ticket ID: Unique identifier for each support request.· Opening & Closing Dates: Track ticket lifecycle from creation (Data Abertura) to resolution (Data Fechamento).· Time Spent (sec): Total duration taken to resolve the ticket (Tempo Gasto).· Status & Movement: Ticket status description and date of status change (Status Descrição, Data Movimento).· SLA Monitoring· SLA ID & Description: Identify and describe service-level agreements tied to each ticket.· SLA Duration (min): Predefined time limits for resolving issues.· SLA Compliance Analysis: Compare actual resolution time against SLA duration.· Ticket Classification· Reason ID & Description: Categorize tickets by their opening reason.· System ID: Track in which system the ticket was registered.· User & Operator Data· User (Opened By): Identifier of the user who initiated the ticket (useraberto).· Operator (Assigned To): Identifier of the support agent handling the ticket (useroperador).· Operator Info: Includes login, role level (Nível), area of expertise, admin status, and registration date.Use Cases & Insights
· Identify tickets breaching SLA and investigate root causes.· Monitor workload distribution among operators.· Analyze ticket volume by reason, system, and status.· Track resolution time trends and efficiency improvements.· Evaluate admin vs. non-admin operator performance.This dashboard serves as a strategic tool to ensure high-quality support services and continuous process improvement.
POWER BI
Logistic DASHBOARD
Logistics Dashboard Summary
The Logistics Dashboard supports the operational efficiency and customer satisfaction goals of an automotive company's logistics department. Designed for monthly meetings with contracted carriers, it offers a detailed view of transport operations, enabling route analysis, carrier performance monitoring, and resource optimization.Analysis Objectives
1. On-Time Delivery (OTD) Performance: Measure the percentage of deliveries made on time to improve punctuality and customer satisfaction.2. Freight Cost Mapping: Visualize freight values based on destination locations to identify regional cost patterns.3. Trips by Vehicle Type: Analyze the distribution of trips across vehicle types (e.g., VUC, Toco, Truck, Carreta) to optimize fleet utilization.4. Freight Cost Evolution: Track freight cost variations over time to inform pricing strategies.5. Total Trips, Weight, and Volume: Assess transportation efficiency through total trips, transported weight, and cargo volume.Key Performance Indicators (KPIs) and Metrics
· On-Time Delivery (OTD): Percentage of deliveries completed within the agreed time frame.· Trip Count by Vehicle Type: Number of trips segmented by vehicle category.· Freight Cost Evolution: Temporal trend analysis of total freight expenses.· Transported Weight and Volume: Total weight and cubic volume of cargo moved.· Regional Performance: Delivery performance by region, split by on-time vs. late deliveries.Use Cases & Insights
· Enhance carrier accountability and performance tracking.· Uncover cost-saving opportunities by analyzing freight spending trends.· Improve fleet planning by understanding vehicle usage patterns.· Support strategic decision-making through clear regional delivery insights.This dashboard acts as a decision-making tool to drive continuous improvements in logistics operations and strengthen partnerships with transportation providers.
POWER BI
FINANCIAL DASHBOARD
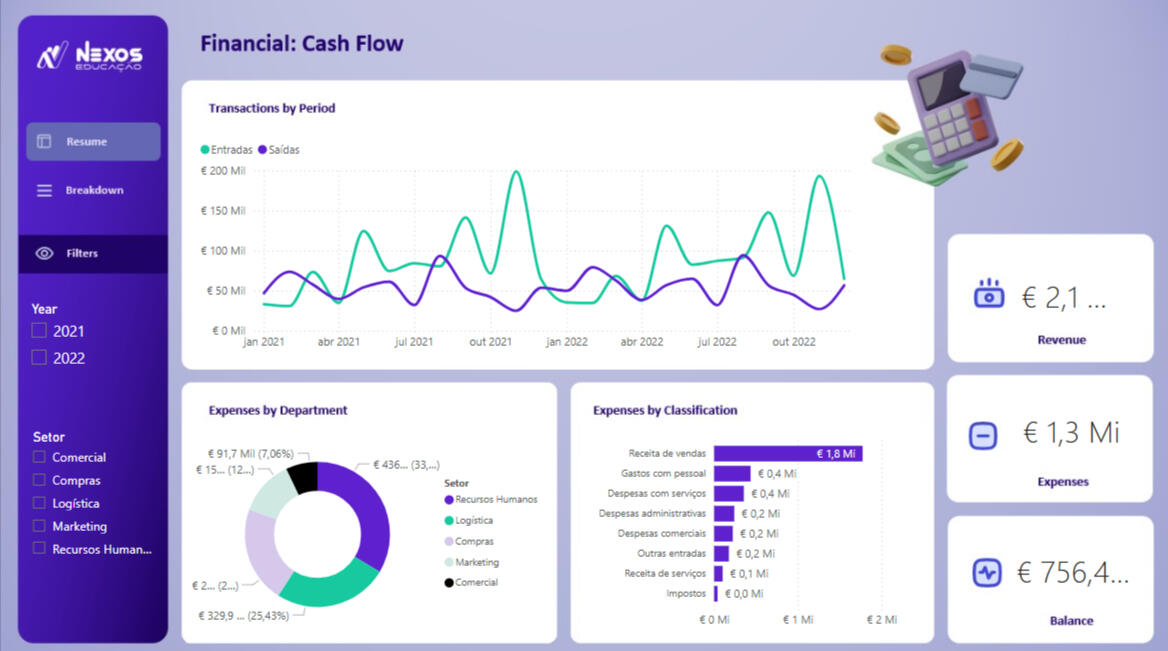
Financial Dashboard Summary
The Financial Dashboard is designed to enhance cash flow management and provide a comprehensive overview of a company’s revenues and expenses. Built in Power BI, it enables detailed financial analysis and supports strategic decision-making and efficient resource management.Analysis Objectives
1. Cash Flow Analysis: Track and compare income and expenses over time, identifying periods of significant variation to support planning for cost containment or investment.2. Financial Summaries: Display total revenues, expenses, and final balances for a clear financial overview.3. Expenses by Cost Classification: Understand the nature of transactions, identify major cost types, and evaluate the contribution of each expense category.4. Expenses by Department: Analyze which departments generate the highest expenses to uncover potential cost-saving opportunities.Key Performance Indicators (KPIs)
· Total Revenue: Measures overall income generated during the analysis period to assess profitability.· Total Expenses: Quantifies all expenses incurred to identify areas for potential cost reduction.· Net Balance: Calculates the difference between revenue and expenses to determine the available financial balance.Use Cases & Insights
· Identify patterns in cash flow and anticipate financial bottlenecks.· Monitor high-expense departments and categories for budget optimization.· Support investment decisions with clear visibility into financial health.· Enable proactive financial planning based on historical and real-time data.This dashboard is a powerful tool for financial control, enabling managers and stakeholders to make informed and strategic decisions with clarity and confidence.